You're 11 days into a training run on 1,024 GPUs. The job is healthy—or at least it was when you checked before leaving for the evening. Then the alert arrives at 2 a.m.
The job is hung. Not a clean exit, but a stall. By the time your team realizes this has happened, finds the last valid checkpoint, and resubmits the job, hours of compute are gone, and your timeline has slipped another week.
Your team tested this run just two weeks ago, and everything was fine. But now, you’re operating on real-world infrastructure at 100x times the scale as your test runs. This kind of failure doesn't come from bad engineering. It comes from expecting infrastructure to do something it wasn't designed to do at this scale.
More compute, more problems?
A distributed training job across hundreds or thousands of GPUs is a coordination problem. In a tightly coupled distributed job, a node that falls behind doesn't just slow down; it can bring the entire job to a crawl.
That single node stalls every other node waiting on that synchronization point. Collective operations like AllReduce hit a wall at scale because one lagging node forces the entire cluster to wait.
The bigger the cluster, the more coordination surface area, and the more ways something can go wrong before anyone knows it.
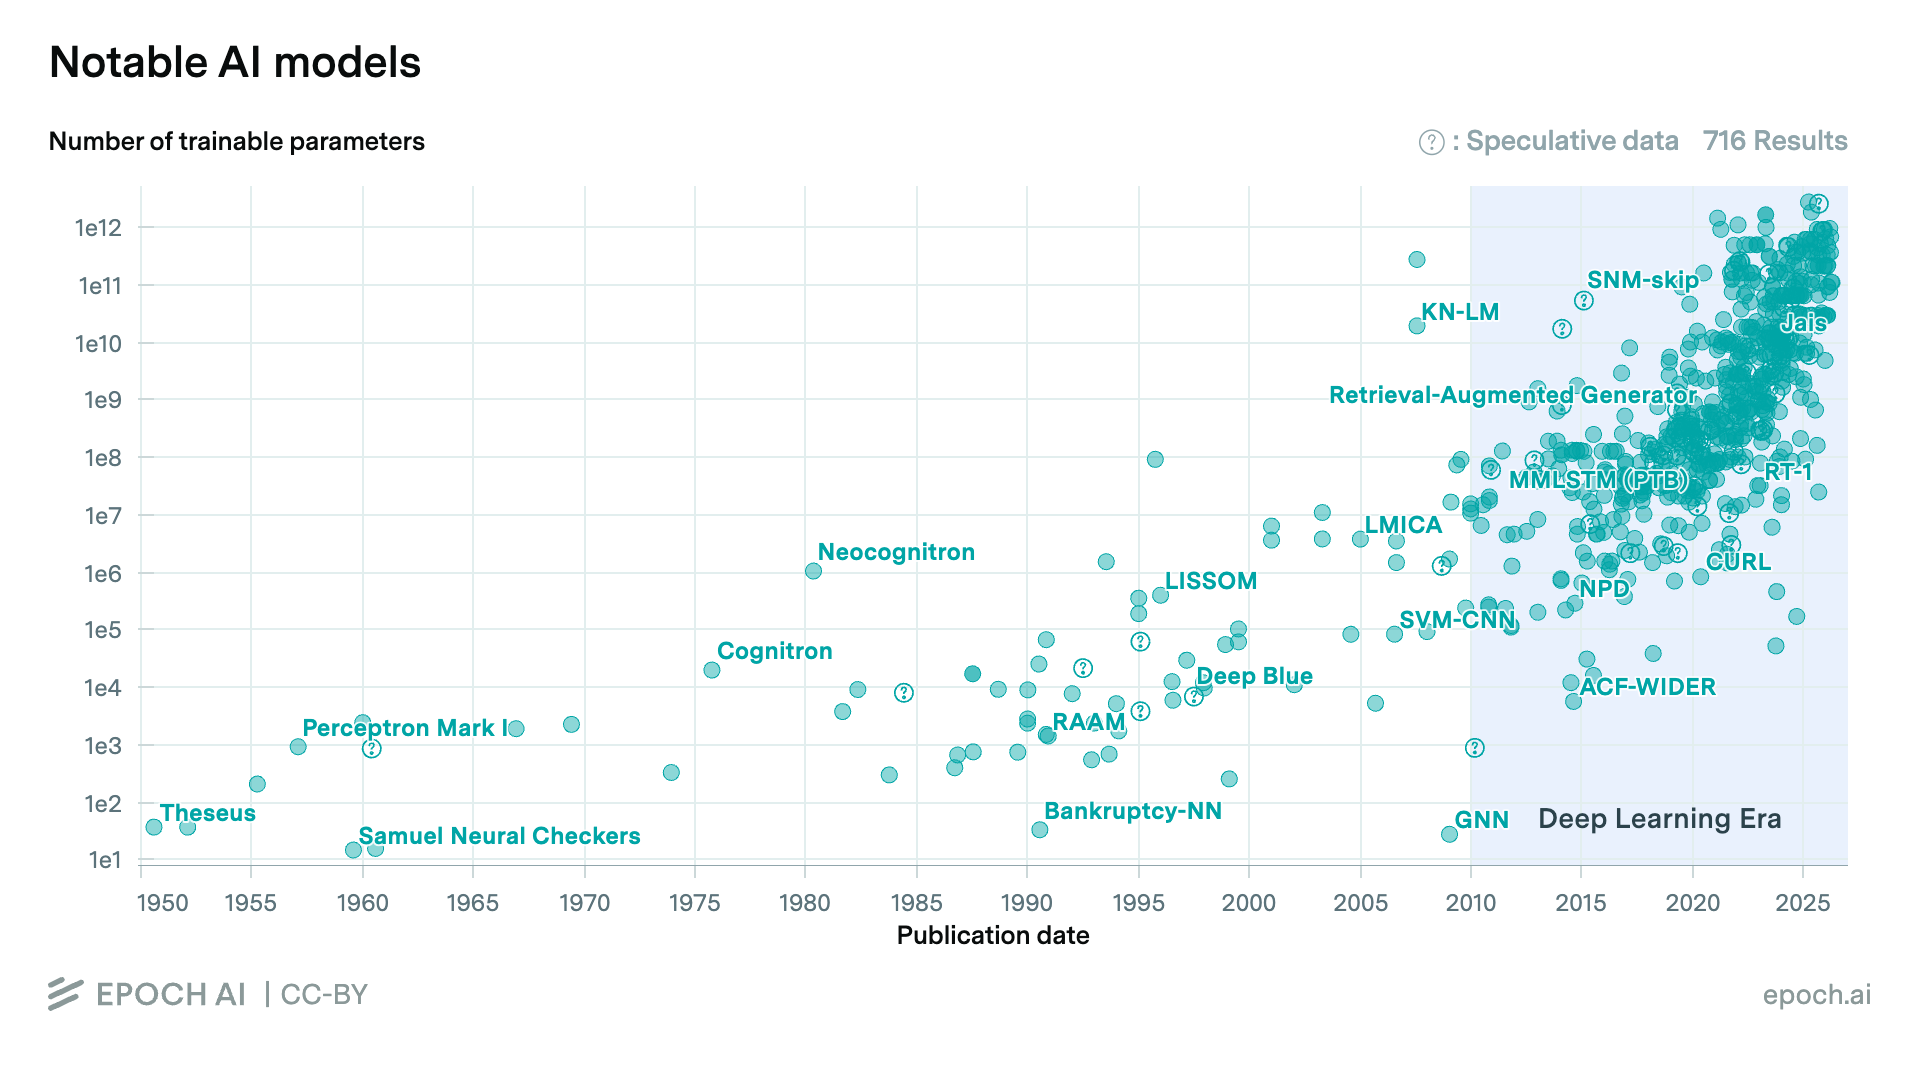
Take a look at the latest report from Epoch AI, which examined a comprehensive database of over 3500 models, tracking key factors driving machine learning progress. Before 2010, the longest AI training runs spanned about seven days. Today, most frontier models train for well over seven days, and many run for 40 days or more—which requires much larger systems.
.png)
Time isn’t the only factor. Model parameter counts have scaled from millions to hundreds of billions. The clusters required to support that growth have followed, training larger models on more and newer GPUs, growing training compute (FLOP) to roughly 4.3x per year since 2010.
Impressive? Yes, but scale changes more than the cost and timeline. It changes the failure profile entirely.
This has created a massive challenge for platform engineers: large-scale distributed training has evolved faster than the infrastructure supporting it.
The GPU coordination challenge
Most on-premises infrastructure and general-purpose cloud weren't built for this reality. General-purpose cloud scales independent workloads. It doesn't scale AI training coordination, so it struggles with distributed training.
As models grow and training runs lengthen, the limits of general-purpose infrastructure don't announce themselves. They show up as utilization gaps, coordination failures, and progress reports nobody wants to deliver.
The numbers reflect this: Research from Meta FAIR shows that mean time to failure (MTTF) drops to 7.9 hours in a 1,024-GPU cluster and to just 1.8 hours at 16,384 GPUs, illustrating the inverse relationship between cluster size and reliability.
- 1,024-GPU Cluster: MTTF is approximately 7.9 hours
- 16,384-GPU Cluster: MTTF drops sharply to just 1.8 hours
More disruptions often means more time spent troubleshooting and more compute wasted. These failures impact key utilization metrics. For example, in a recent Signal65 report, the current industry baseline for Model FLOPs Utilization (MFU) during large-scale AI training is generally considered to be 35–45%. Goodput, the percentage of time a system spends doing useful training work versus handling interruptions, averages ~90% across the industry.
This efficiency gap exists for predictable reasons: communication overhead across distributed nodes, memory access constraints, and synchronization requirements all limit how much theoretical peak performance actually translates to model computation. As cluster size grows, the coordination surface area expands, leading to more cumulative drag from overhead that already limits utilization at smaller scales.
The three places distributed training breaks
Infrastructure failures in large-scale training aren't random. They cluster around three predictable failure modes. Understanding them is the first step toward designing for them.
1. Compute failures
GPU faults, thermal drift, and ECC (error-correcting code) errors that degrade silently before they crash a job. The insidious quality of these failures is that they often don't cause an immediate crash. They introduce silent degradation that poisons training progress before anyone notices. By the time the job fails, the last valid checkpoint may be hours old.
Thermal throttling is a particularly common and underdiagnosed version of this. A GPU that throttles to stay within its power or temperature envelope becomes a permanent straggler, forcing every other healthy GPU in the job to wait at the next synchronization barrier. You aren't just losing one GPU; you're losing the aggregate throughput of the entire cluster.
2. Coordination failures
Straggler nodes, synchronization stalls, and AllReduce bottlenecks. These are not hardware failures in the traditional sense. The node is still running, but the training step cannot be completed until every participant finishes. At scale, the probability of encountering at least one straggler on any given step approaches certainty. The question is whether the infrastructure is built to detect, isolate, and route around it.
3. Recovery failures
What happens after something breaks matters as much as the failure itself. An infrastructure that fails slowly, checkpoints infrequently, and restarts from scratch compounds the original failure into a much larger loss of time and compute. The difference between a job that recovers in minutes and one that requires a full restart from an eight-hour-old checkpoint can translate into days of lost progress on long training runs.
When every error looks like an NCCL error
There's a fourth failure mode that doesn't get enough attention: the failure to diagnose failures accurately.
When something goes wrong in a distributed training job, the error that surfaces most often appears as an NCCL error. NCCL is the communication layer; it's where distributed jobs surface symptoms. But NCCL errors are symptoms, not causes. The actual failure could have originated at the GPU hardware layer, in a straggler, in a memory fault, in a misconfigured network path, or in a software issue entirely unrelated to communication.
Teams can spend hours, sometimes days, chasing the wrong layer because every error looks the same at the surface. Without deep observability that correlates infrastructure telemetry with application behavior, the diagnostic process is guesswork. And guesswork at 2 a.m. on day 11 of a training run is expensive. The image below shows what a distributed training failure looks like in an error log.

Mini case study: ByteDance
Last May, ByteDance published a study of its own dedicated, well-optimized production cluster to see just how pervasive GPU stragglers were in its large-scale LLM training runs. The cluster uses homogeneous hardware, dedicated job allocation, and in-house network optimizations.
Results
- 42.5% of jobs experienced straggler-induced slowdowns, meaning nearly half of all production training runs are meaningfully impacted
- 10.4% of total allocated GPU-hours wasted due to stragglers, resulting in compute that was paid for but produced nothing
Analysis findings
- Infrastructure impacted stragglers more than environmental noise
Critically, stragglers were not caused by transient issues. Most steps within a straggling job show similar slowdowns, indicating persistent underlying problems rather than random environmental noise. - Architecture, not hardware, lead to more interruptions
Faulty hardware explained only a small fraction of cases. Problematic workers contributed more than 50% of the observed slowdown in only 1.7% of straggling jobs. This meant the vast majority of coordination failures stem from architectural and workload factors, not broken machines.
Even in this purpose-built training environment and with an on-call team actively monitoring jobs, ByteDance saw that nearly half of the runs were still slowed by stragglers, and one in ten GPU-hours was wasted.
If this is the baseline at hyperscale with best-in-class infrastructure management, the problem is unlikely to be better in general-purpose cloud environments where those optimizations don't exist.
So if ByteDance, the creator of large-scale frontier models, still experienced this challenge, what’s the solution? To build resilient-by-design infrastructure that can support large-scale distributed training.
What “resilient by design” really means
Here's what most teams do when they hit these problems: they fix them. They add monitoring. They write better restart logic. They tune checkpoint frequency. They document which NCCL error patterns tend to indicate which underlying causes.
These things help. But they're band-aids applied to a systemic problem.
The 2 a.m. alert is a symptom. The architecture is the cause.
I can share the most common errors and the standard fixes. But if you're operating at scale, you need more than manual interventions and accumulated tribal knowledge. You need a reference architecture where resilience is a property of the system, not something bolted on after the fact.
A system that can recover gracefully from failures is not resilient—it is merely recoverable. A resilient system is one where failure modes are anticipated in the design, failure surfaces are minimized, and recovery is fast, automatic, and predictable.
Check out these related assets for more information:
- Check your infrastructure's readiness Can Your Infrastructure Take the Punch?
- Watch the webinar Real Cloud Infrastructure for Real AI Workloads: Training and Inference at Production Scale
- 4 practical ways to validate your resilience today Engineering Confidence: 4 Ways to Validate and Strengthen Your AI Infrastructure Resilience


.avif)