Building something new shouldn’t require learning every infrastructure lesson the hard way. Operating AI at frontier scale has taught us how workloads behave in production, where performance gets lost, and what it takes to recover it. We want your team to build on that experience.
CoreWeave Mission Control™ is our operating standard for production AI. Built into CoreWeave Cloud, it connects deep observability, continuous infrastructure operations, and AI-assisted insights to help your team improve performance and efficiency across the entire AI loop. Whether you’re building an agent or training a model, what happens when it runs should help you decide what to improve next.
Today, CoreWeave Mission Control MCP becomes generally available and CoreWeave Mission Control Agent now extends to the console. Both draw on the telemetry we use to operate the fleet, giving your team new ways to investigate and improve workloads through your own agents or in the CoreWeave console.
The operational intelligence behind CoreWeave Mission Control
The AI loop becomes more useful when you can connect an application’s behavior to the systems underneath it. CoreWeave Mission Control connects workload behavior with infrastructure signals all the way down to the metal, helping developers, researchers, and platform teams understand whether a slowdown calls for a change to the workload, its configuration, or the infrastructure.
Because we operate the infrastructure, we can expose chip, chassis, rack, network fabric, cooling, and hardware-verification telemetry from deployment, without additional configuration or charge. That includes fan speeds, valve operations, system event logs, and fabric link faults. On CoreWeave, that hardware observability is part of the platform, so your team doesn’t have to own the metal to understand what’s happening underneath its workloads. We also leverage that visibility to help keep the infrastructure healthy through continuous automation, including rack lifecycle systems such as Racky and Valvey.
Telemetry Relay also sends supported CoreWeave telemetry to your existing observability tools, so you can investigate those signals alongside data from your other systems.
Our internal performance lake holds performance data across jobs, helping CoreWeave Mission Control understand what good looks like for a given workload shape rather than simply flagging that a metric moved. Lessons from Direct-to-Expert engagements feed an internal knowledge base, supporting experts who use the same operational data in their investigations. That experience informs the curated alerts, dashboards, and AI-assisted insights your team uses, which means that you don’t have to waste time and effort rediscovering every pattern yourself.
Racky and Valvey are part of our rack lifecycle automation, alongside fleet and node lifecycle controls and ongoing hardware verification. These systems help detect and remediate infrastructure faults whether or not you open a dashboard.
For the settings your team controls, CoreWeave Mission Control helps identify the bottleneck, estimate what’s recoverable, and recommend a change. Together with the work we do on the infrastructure, that helps you get more useful work from the GPU hours you’re paying for.
Investigating workloads with CoreWeave Mission Control MCP
CoreWeave Mission Control MCP is a hosted, read-only Model Context Protocol server. Connect Claude Code, Cursor, Codex, or another MCP-compatible client to query metrics, logs, dashboards, alerts, documentation, and resource state, scoped to your organization through your CoreWeave API token.
We want your team spending its time working through the problem, rather than iteratively gathering evidence from one tool after another. Ask why a training run has slowed down, and your agent will bring together the relevant GPU and node signals, alerts, and repeated log messages without moving between Grafana, documentation, and CLI output. The same approach helps when an inference deployment starts losing throughput and you need to understand what changed.
Your agent can also inspect clusters, nodes, Slurm on Kubernetes (SUNK) resources, and CoreWeave AI Object Storage (CAOIS) buckets. This brings the state of those resources into the investigation alongside metrics and logs.
The server exposes small, composable tools. Your agent can discover metric labels before querying, check log volume before pulling a stream, and consult current CoreWeave documentation. Reusable investigation guidance helps it scope queries and separate observations from inference, making the evidence easier to inspect and retrace.
Inside CoreWeave, Rick Donohue, one of our facilities engineers, used that connection to investigate a question about condensation. He understood how temperature and humidity related to the problem and knew we collected the readings. With MCP connected to Claude, he queried VictoriaMetrics, identified readings approaching condensation conditions, and generated JavaScript to plot selected readings on a psychrometric chart in a dashboard.
I essentially did a thought experiment with Claude based on some knowledge I had about condensation issues, and knew we had temp/humidity data. Pretty amazing really.
Rick Donohue, Facility Engineer, CoreWeave
What I like about Rick’s example is that he could simply start with the problem he understood, rather than the queries and scripts needed to investigate it.
Improving deployments with the CoreWeave Mission Control Agent
The CoreWeave Mission Control Agent brings that operational intelligence into the console. When a deployment isn't performing as expected, it reads the deployment telemetry, names the bottleneck, and tells you what fixing it is worth."
Watch how to ask questions and explore the evidence through CoreWeave Mission Control MCP (or the Agent in console).
Here’s how an investigation played out for a team building an agent application on Dedicated Inference. As the application grew, requests carried longer contexts, with system prompts, tool definitions, and retrieved documents that the original configuration wasn’t sized for. Throughput began falling even though the infrastructure looked healthy, and the team was still paying for the same GPU hours.
The team asked, “My throughput dropped and my bill didn’t. What’s going on?”
In this scenario, the Agent connects falling prefix-cache hit rates, rising preemptions, and per-GPU utilization to pressure on the key-value (KV) cache. Long contexts fill the available cache, evictions force prefill work to be repeated, and fewer requests can run concurrently. Looking at these signals together helps explain how the application’s changing behavior is affecting memory use across the GPUs.
The Agent recommended two changes in sequence.
- Quantize. Move the model weights to NVFP4 and evaluate FP8 for the KV cache. Reducing the memory footprint leaves more headroom for cached context on the same hardware, addressing the pressure behind the repeated work. The team compares model quality evaluations before and after the change rather than assuming lower precision preserves the quality its application needs.
- Reshape. Revisit how the model is distributed across GPUs now that it uses less memory. A model that previously needed tensor parallelism across eight GPUs might now fit across four, allowing the same eight GPUs to run two replicas instead of one. The Agent evaluates the layout using workload characterization data, NVLink topology, and the tradeoff between all-reduce communication cost and KV-cache pooling.
The recommendations belong together because reducing the memory requirements changes the deployment options worth evaluating. Your team still decides which changes make sense for the application. For this team, recovering throughput meant more room to grow the application on the infrastructure it already has.
Bringing AI development and operations closer together
Before you change an experiment to address a slow run, you need to understand whether the infrastructure contributed to it. In Weights & Biases (W&B), researchers can see node failures and slowdowns and thermal violations alongside training metrics, giving them context to investigate the slowdown before deciding what to change.
I’m excited about where we can take this with CoreWeave ARIA, our AI Research and Iteration Agent. ARIA helps researchers analyze results, find patterns across runs, and decide what to try next. We want to keep bringing that research understanding and the operational intelligence behind CoreWeave Mission Control closer together as our tools evolve. The goal is to help your team draw on both when deciding what to change, whether that's a model or the application built around it.
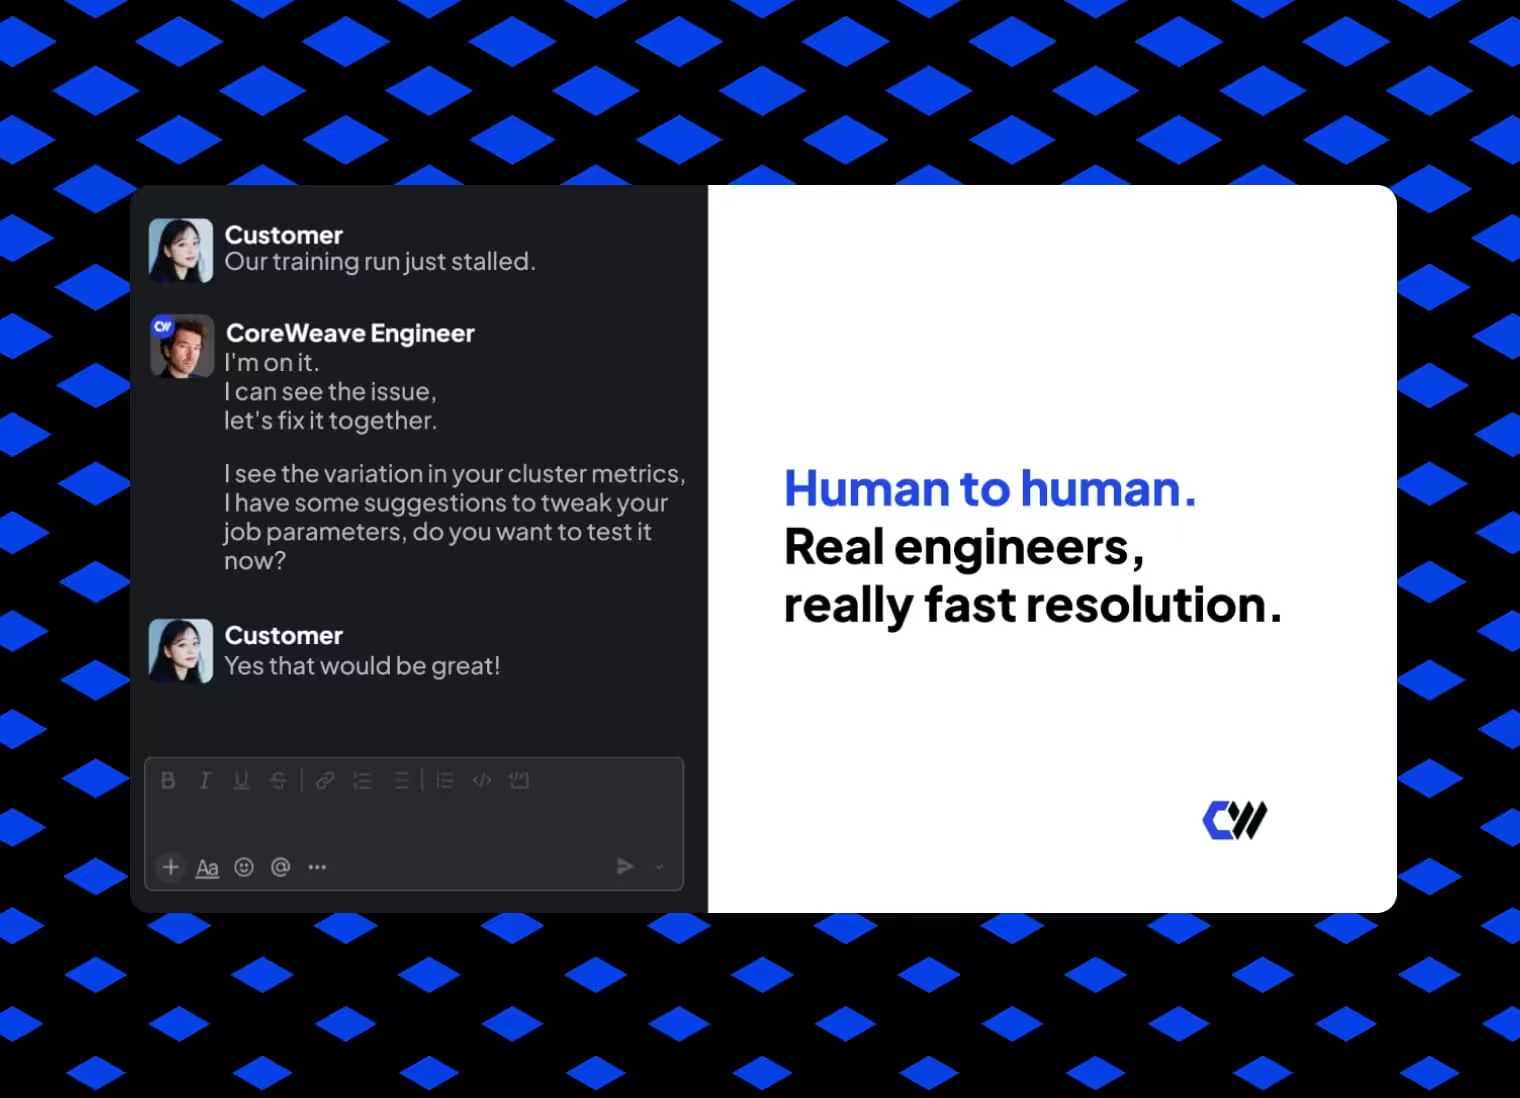
We don’t want the place where you start an investigation to limit what you can understand. Developers, researchers, and platform teams should be able to follow a problem across the stack, rather than pass it back and forth.
Getting started with CoreWeave Mission Control
Use CoreWeave Mission Control MCP to build investigations into your own agents and tools, or explore the CoreWeave Mission Control Agent in the console for deployment recommendations. Start with the MCP setup documentation or contact your CoreWeave team about preview access. We want the experience we’ve earned at frontier scale to give your team more room to build, with less time lost to operational problems we’ve already worked through.