A medical question-answering service runs for three weeks without a single failure alert. It handles thousands of requests a day: symptom lookups, condition explanations, triage guidance. No job failures. No error spikes. The dashboard looks clean.
However, user complaints are filing in: completions are taking longer to arrive, and responses feel delayed mid-answer.
You pull the metrics and immediately find the issue: p99 time-to-first-token (TTFT) latency climbed from 180ms to 240ms over 11 days, a 33% increase from baseline. Peak-hour availability slipped from 99.9% to 99.1%. Neither crossed an alert threshold nor caused an outright failure. Your users had been experiencing quality degradation for nearly two weeks.
Why drift is difficult to diagnose
In production inference, latency and availability don't fail loudly. They drift, and that drift is the hardest class of problem to catch.
Because the failure mode is gradual, diagnosis is expensive. Teams spend hours chasing symptoms at the wrong layer—investigating the model, checking the API, reviewing recent deployments—before identifying that the problem is structural, not incidental. By that point, the cost in user experience and engineering time is already paid.
Latency drift and availability degradation at production scale aren't random events. They're the predictable output of infrastructure that wasn't built to handle the specific coordination demands of inference. Understanding where drift originates is the first step toward building systems that don't accumulate it.
Where latency breaks down at scale
Latency drift isn't one problem. It's three different problems that tend to compound each other as inference workloads scale.
1. Infrastructure-layer variability
General-purpose cloud infrastructure is designed for flexible, heterogeneous workloads. Inference demands the opposite: it's continuous, latency-sensitive, and highly sensitive to resource contention.
At a small scale, requests rarely compete for resources. At production scale, GPU contention becomes constant, and scheduling overhead (the additional time required to get GPUs working on a job, on top of compute itself) scales with request volume. What adds negligible latency at 50 requests per second becomes meaningful at 5,000. Noisy neighbors on shared networking paths introduce jitter that appears in tail latency first. The p50 looks fine, but the p99 tells a different story.
2. Model-serving configuration drift
Configuration choices that work at low traffic become latency sources as load grows:
- Batching: static batching is the tour bus; it waits until full before it leaves, so fast requests sit idle until the slowest one boards. Continuous batching is the subway; it requests board and exit at every stop, keeping the GPU full. But the subway has its own problem: a long incoming prompt (prefill) can hold up the platform for everyone already in transit (decode), producing ITL jitter that shows up as latency drift under load. Misconfigured chunked prefill (either disabled or set too large) amplifies this: when a large request arrives, it stalls decode for all concurrent requests until prefill completes.
- KV cache pressure: as context windows lengthen and sessions multiply, the engine begins evicting or preempting in-flight requests to free space, adding recomputation overhead that doesn't show up in error rates but does show up in p99.
None of these show up as errors. All of them show up as p99 degradation.
3. Traffic pattern mismatch
Autoscaling is the most common failure point. Cloud autoscaling systems respond to observed demand with lag. A new pod may be online in roughly 90 seconds; a new node may take several minutes. When an unexpected traffic burst arrives and your autoscaler can't keep up, requests queue, latency climbs, and if the burst is sustained, requests begin to timeout.
Consider the inference service for medical questions mentioned before. Traffic is steady most of the day until, hypothetically, a major news outlet publishes a story about a rare illness in a major city. Requests spike suddenly and without warning. If your infrastructure can't absorb that queue, users experience the degradation immediately. The service never goes down; it just slows until the burst passes.
The subtler version is request shape. Not all inference requests take the same amount of time, even if your autoscaler counts them the same way. If your infrastructure was sized for average request complexity, any period where your heaviest requests cluster together will saturate capacity faster than your scaling policy expects. In this case, users will feel it before the system catches up.
What to measure for latency drift
Standard monitoring often misses drift because it tracks averages. Averages hide tail behavior almost by design.
If you're tracking only average latency and aggregate request counts, you will likely miss drift.
How availability degrades without failing
Availability degradation in production inference rarely looks like downtime. It looks like a slow accumulation of imperfect outcomes.
Elevated error rates are the most common pattern. A medical answering service running at 99.9% availability starts returning HTTP 504 timeouts at 0.3% during peak hours. The uptime monitor still shows green. But at 100,000 requests per hour, that's 300 users per hour hitting a timeout.
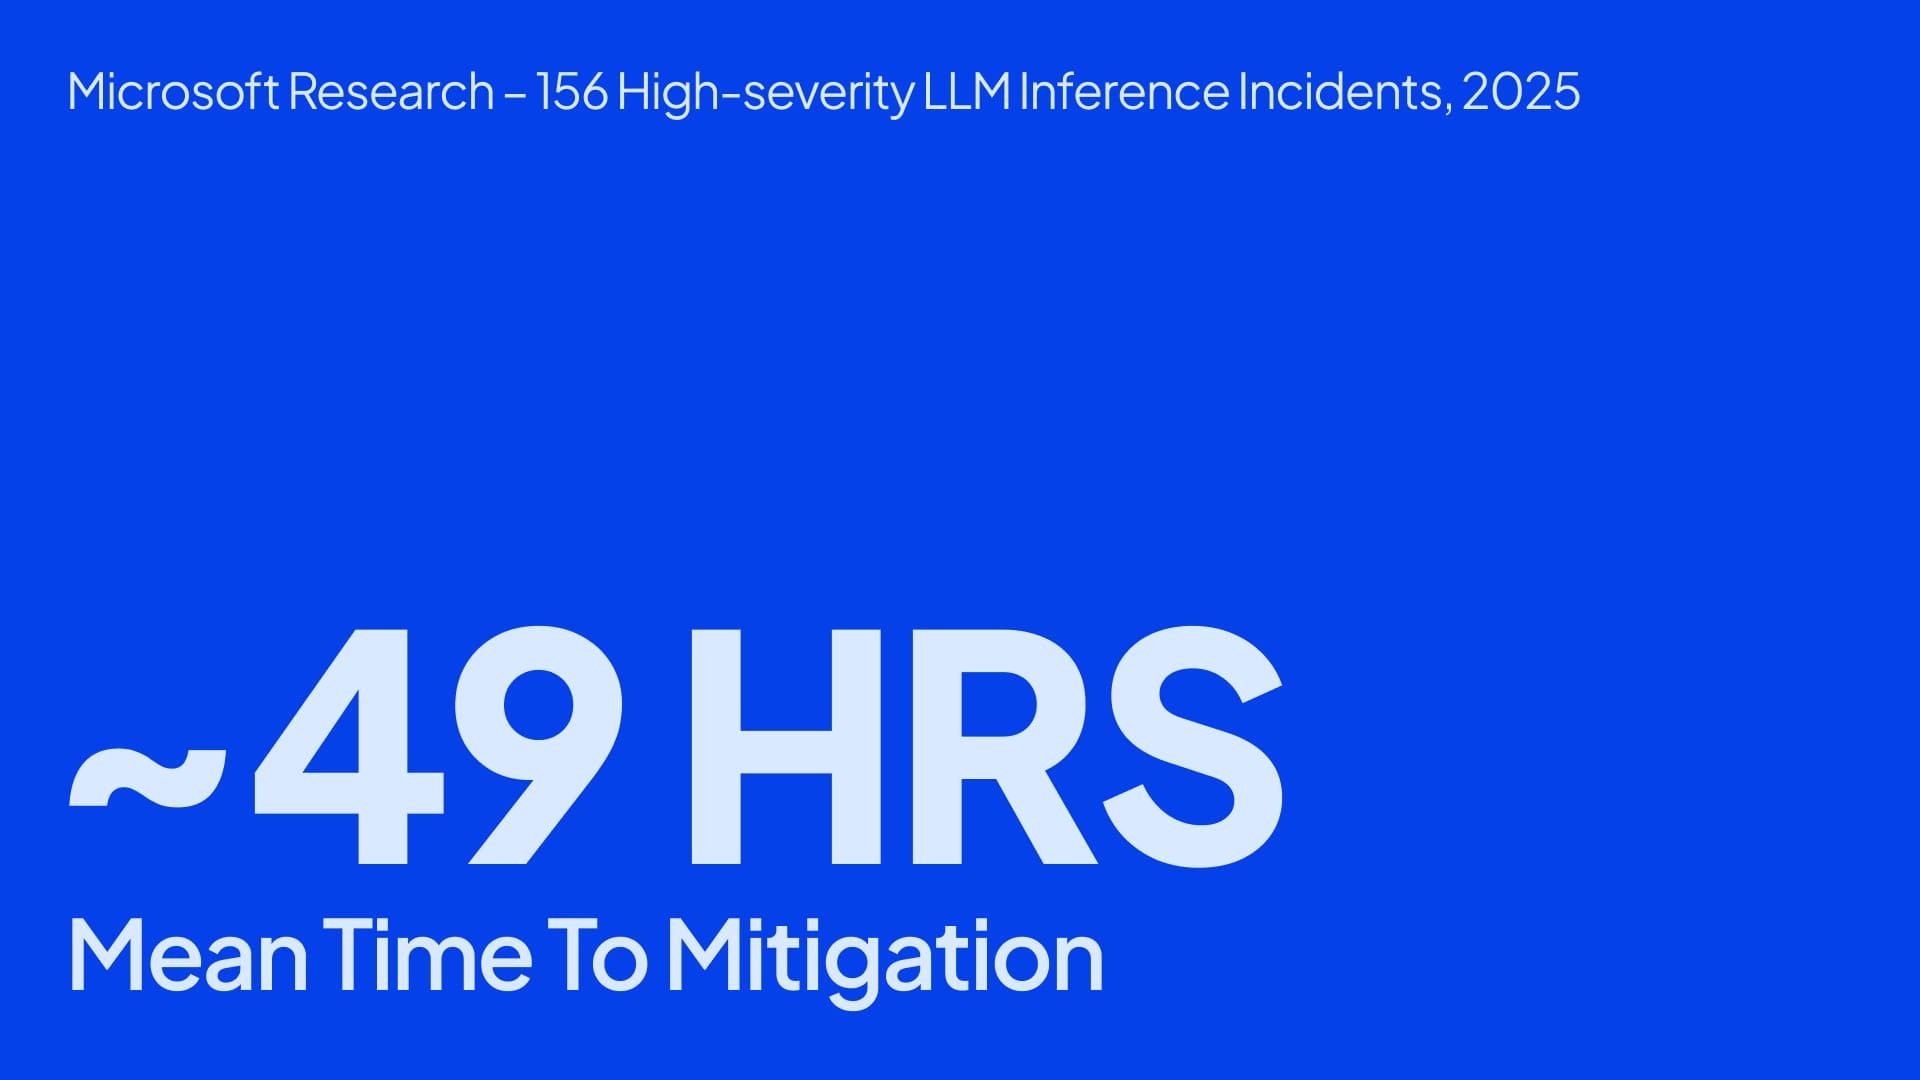
The scale of the problem is well-documented. A 2025 Microsoft Research study analyzing 156 high-severity LLM inference incidents at hyperscale offers one of the clearest pictures of how frequently, and why, production inference availability breaks down. A 49-hour mean time to mitigation isn't an operational problem—it's an architectural one. When incidents can only be resolved through manual traffic routing, node rebalancing, or capacity increases, the infrastructure itself is the bottleneck.
Autoscaling lag is where latency problems become availability problems. The distinction matters: during a sustained burst, latency degradation that goes unmanaged long enough causes requests to timeout entirely. What started as slower responses becomes failed responses, without the service ever going down or your team classifying it as an incident.
Stale cache behavior adds a quieter availability failure. As KV cache eviction and preemption rates increase under load, some requests require recomputation that pushes response time past acceptable thresholds. The outputs eventually arrive, just too late to be useful. Monitoring won't catch it. Users will.
The unifying pattern across all of these is that the system technically appears to be"up," but it is not working consistently for the users who depend on it.
What to measure for availability degradation
Uptime monitors answer a binary question: Is the service responding? It doesn’t answer the question that matters: Is the service working?
The frame that's most useful: the gap between "the system is up" and "the system is working" is where production availability actually lives. Monitoring that tracks only the former will miss degradation until it becomes an incident.
What "stable by design" actually means
The teams that avoid chronic latency drift and soft availability failures share a common approach: they treat reliability as an architectural property, not a monitoring problem.
This distinction matters because monitoring can only tell you that drift has occurred. Architecture determines whether drift accumulates in the first place. The key is making preventive infrastructure choices before instability reaches users, rather than tuning problems after the fact. Inference infrastructure that stays stable under real-world demand will four key properties:
- Explicit GPU allocation
- Traffic-aware autoscaling
- Infrastructure-aligned SLAs
- Predictable networking
All these properties make the system's behavior visible and predictable before failures occur, rather than after.
Better alerting won't fix a structural gap
If your inference stack is accumulating drift, the first question to ask is not "How do we monitor better?" It's "Is our infrastructure built for inference specifically, or did we deploy inference on infrastructure designed for something else?"
The infrastructure decisions you make for inference have downstream consequences for your model iteration cycle, your fine-tuning cadence, and the RL loops that improve your models post-deployment.
If you're running inference at scale, you need more than better dashboards, diagnostics, and reactive fixes. You need infrastructure where stable latency and predictable availability are properties of the system, not outcomes you're constantly chasing.
Check out these related assets for more information:
- Read the blog: Can It Scale? How Autoscaling Impacts Compute Costs for Inference
- Watch the webinar: Unlock Agentic Breakthroughs with a Purpose-Built AI Cloud
- Read the blog: Engineering Confidence: 4 Ways to Validate and Strengthen Your AI Infrastructure Resilience
Ready to talk through your inference architecture? Connect with a CoreWeave expert to learn how we can support your inference goals.


.avif)